BESTE WEBSITE FÜR WEBENTWICKLER

Python Tutorial

Python HEIM Python Einführung Python Loslegen Python Syntax Python Kommentare Python Variablen Python Datentypen Python Zahlen Python Casting Python Strings Python Boolesche Werte Python Betreiber Python Listen Python Tupel Python-Sets Python-Wörterbücher Python If...Else Python While Schleifen Python For Schleifen Python Funktionen Python Lambda Python Arrays Python Klassen/Objekte Python Nachlass Python Iteratoren Python Polymorphismus Python Umfang Python Module Python Termine Python Mathematik Python JSON Python RegEx Python PIP Python Try...Except Python Benutzereingabe Python String-Formatierung

File Handhabung

Python Dateiverwaltung Python Dateien lesen Python Dateien schreiben/erstellen Python Dateien löschen

Python Module

NumPy Lernprogramm Pandas Lernprogramm SciPy Lernprogramm Django Lernprogramm

Python Matplotlib

Matplotlib Einführung Matplotlib Loslegen Matplotlib Pyplot Matplotlib Plotting Matplotlib Markers Matplotlib Line Matplotlib Labels Matplotlib Grid Matplotlib Subplots Matplotlib Scatter Matplotlib Bars Matplotlib Histograms Matplotlib Pie Charts

Maschinelles Lernen

Erste Schritte Mittlerer Medianmodus Standardabweichung Perzentil Datenverteilung Normale Datenverteilung Streudiagramm Lineare Regression Polynomielle Regression Multiple Regression Skala Trainieren/Testen Entscheidungsbaum Verwirrung Matrix Hierarchisches Clustering Logistische Regression Rastersuche Kategoriale Daten K-bedeutet Bootstrap Anhäufung Kreuzvalidierung AUC – ROC-Kurve K-nächste Nachbarn

Python MySQL

MySQL Loslegen MySQL Create Database MySQL Create Table MySQL Insert MySQL Select MySQL Where MySQL Order By MySQL Delete MySQL Drop Table MySQL Update MySQL Limit MySQL Join

Python MongoDB

MongoDB Loslegen MongoDB Create Database MongoDB Create Collection MongoDB Insert MongoDB Find MongoDB Query MongoDB Sort MongoDB Delete MongoDB Drop Collection MongoDB Update MongoDB Limit

Python Referenz

Python Überblick Python Integrierte Funktionen Python String-Methoden Python Methoden auflisten Python Wörterbuchmethoden Python Tupelmethoden Python Methoden festlegen Python Dateimethoden Python Schlüsselwörter Python Ausnahmen Python Glossar

Modulreferenz

Random Modul Requests Modul Statistics Modul Math Modul cMath Modul

Python wie man

Listenduplikate entfernen Einen String umkehren Addiere zwei Zahlen

Python Beispiele

Python Beispiele Python Compiler Python Übungen Python Quiz Python Boot Camp Python Zertifikat

Python. Unterricht für Anfänger

Ua En Es

Matplotlib Beschriftungen und Titel


Erstellen Sie Beschriftungen für einen Plot

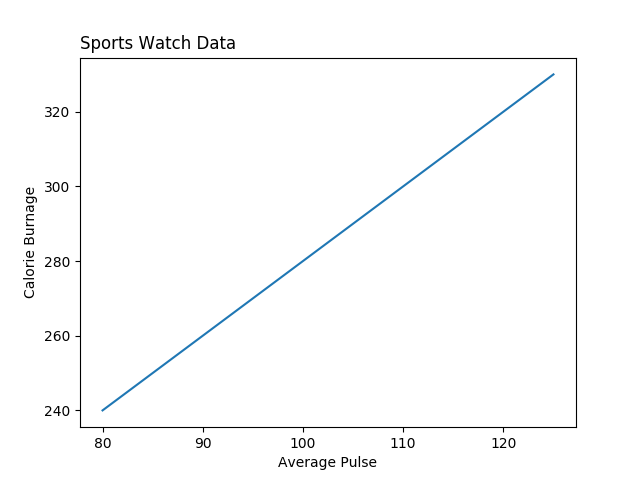
Mit Pyplot können Sie die Funktionen xlabel() und ylabel() verwenden, um eine Beschriftung festzulegen für die x- und y-Achse.

Beispiel

Fügen Sie Beschriftungen zur x- und y-Achse hinzu:

import numpy as np
import matplotlib.pyplot as plt

x = np.array([80, 85, 90, 95, 100, 105, 110, 115, 120, 125])
y = np.array([240, 250, 260, 270, 280, 290, 300, 310, 320, 330])

plt.plot(x, y)

plt.xlabel("Average Pulse")
plt.ylabel("Calorie Burnage")

plt.show()

Ergebnis:

Matplotlib labels

Try it Yourself »

Erstellen Sie einen Titel für eine Handlung

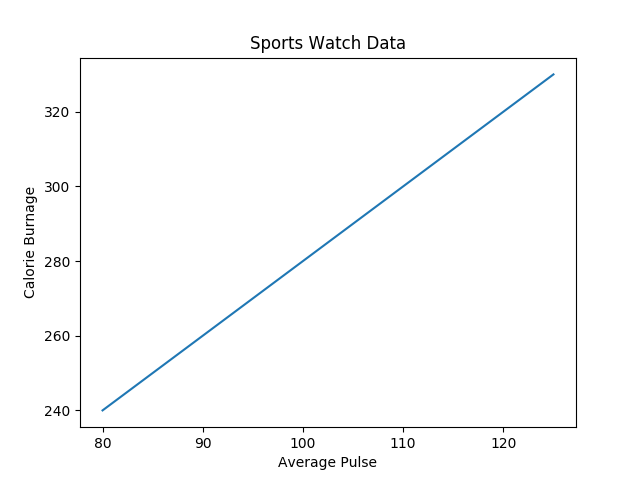
Mit Pyplot können Sie die Funktion title() verwenden, um einen Titel für die Handlung festzulegen.

Beispiel

Fügen Sie einen Plottitel und Beschriftungen für die x- und y-Achse hinzu:

import numpy as np
import matplotlib.pyplot as plt

x = np.array([80, 85, 90, 95, 100, 105, 110, 115, 120, 125])
y = np.array([240, 250, 260, 270, 280, 290, 300, 310, 320, 330])

plt.plot(x, y)

plt.title("Sports Watch Data")
plt.xlabel("Average Pulse")
plt.ylabel("Calorie Burnage")

plt.show()

Ergebnis:

Matplotlib title

Try it Yourself »

Legen Sie Schriftarteigenschaften für Titel und Beschriftungen fest

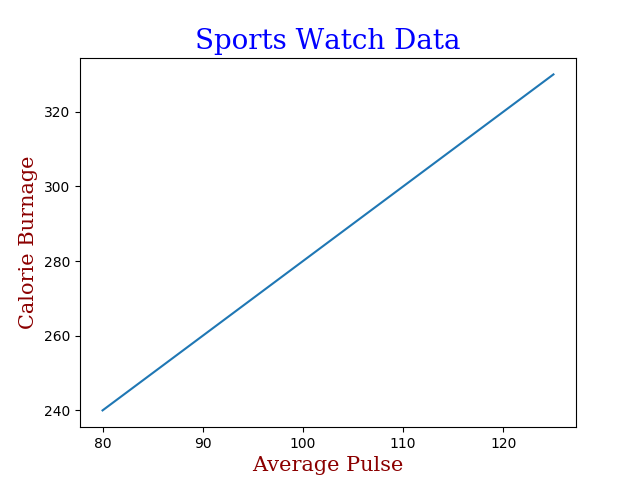
Sie können den Parameter fontdict verwenden xlabel(), ylabel(), und title() um Schriftarteigenschaften für den Titel und die Beschriftungen festzulegen.

Beispiel

Legen Sie Schriftarteigenschaften für Titel und Beschriftungen fest:

import numpy as np
import matplotlib.pyplot as plt

x = np.array([80, 85, 90, 95, 100, 105, 110, 115, 120, 125])
y = np.array([240, 250, 260, 270, 280, 290, 300, 310, 320, 330])

font1 = {'family':'serif','color':'blue','size':20}
font2 = {'family':'serif','color':'darkred','size':15}

plt.title("Sports Watch Data", fontdict = font1)
plt.xlabel("Average Pulse", fontdict = font2)
plt.ylabel("Calorie Burnage", fontdict = font2)

plt.plot(x, y)
plt.show()

Ergebnis:

Matplotlib title font dict

Try it Yourself »

Positionieren Sie den Titel

Sie können den Parameter loc in title() verwenden, um den Titel zu positionieren.

Gesetzliche Werte sind: 'left', 'right', und 'center'. Der Standardwert ist 'center'.

Beispiel

Positionieren Sie den Titel links:

import numpy as np
import matplotlib.pyplot as plt

x = np.array([80, 85, 90, 95, 100, 105, 110, 115, 120, 125])
y = np.array([240, 250, 260, 270, 280, 290, 300, 310, 320, 330])

plt.title("Sports Watch Data", loc = 'left')
plt.xlabel("Average Pulse")
plt.ylabel("Calorie Burnage")

plt.plot(x, y)
plt.show()

Ergebnis:

Matplotlib title loc

Try it Yourself »