Matplotlib Etiquetas y Título
Crear etiquetas para una trama
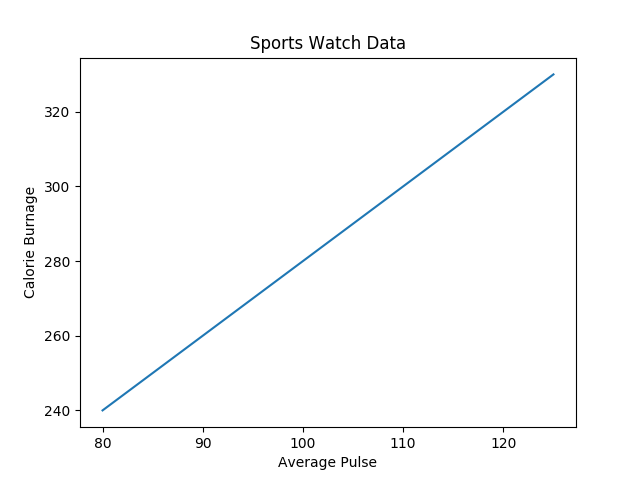
Con Pyplot, puedes usar las funciones xlabel() y ylabel() para establecer una etiqueta para los ejes x e y.
Ejemplo
Agregar etiquetas a los ejes x e y:
import numpy as np
import matplotlib.pyplot as plt
x = np.array([80, 85, 90, 95, 100, 105, 110, 115, 120, 125])
y = np.array([240, 250, 260, 270, 280, 290, 300, 310, 320, 330])
plt.plot(x, y)
plt.xlabel("Average Pulse")
plt.ylabel("Calorie Burnage")
plt.show()
Resultado:

Crear un título para una trama
Con Pyplot, puede utilizar la función title() para establecer un título para el gráfico.
Ejemplo
Agregue un título de trazado y etiquetas para los ejes x e y:
import numpy as np
import matplotlib.pyplot as plt
x = np.array([80, 85, 90, 95, 100, 105, 110, 115, 120, 125])
y = np.array([240, 250, 260, 270, 280, 290, 300, 310, 320, 330])
plt.plot(x, y)
plt.title("Sports Watch Data")
plt.xlabel("Average Pulse")
plt.ylabel("Calorie Burnage")
plt.show()
Resultado:

Establecer propiedades de fuente para título y etiquetas
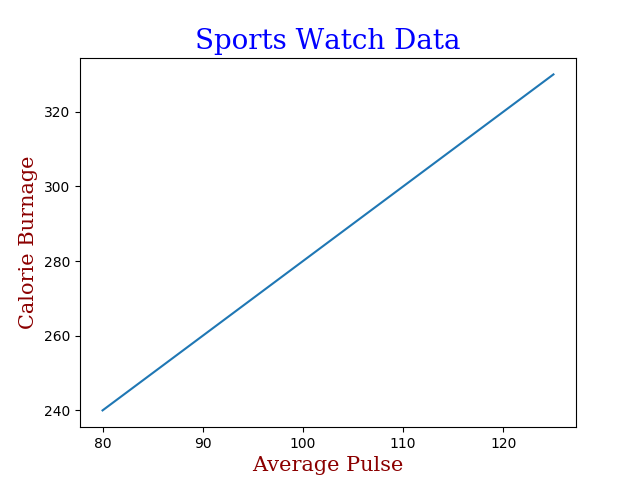
Puedes utilizar el parámetro fontdict en xlabel(), ylabel() y title() para establecer propiedades de fuente para el título y las etiquetas.
Ejemplo
Establecer propiedades de fuente para el título y las etiquetas:
import numpy as np
import matplotlib.pyplot as plt
x = np.array([80, 85, 90, 95, 100, 105, 110, 115, 120, 125])
y = np.array([240, 250, 260, 270, 280, 290, 300, 310, 320, 330])
font1 = {'family':'serif','color':'blue','size':20}
font2 = {'family':'serif','color':'darkred','size':15}
plt.title("Sports Watch Data", fontdict = font1)
plt.xlabel("Average Pulse", fontdict = font2)
plt.ylabel("Calorie Burnage", fontdict = font2)
plt.plot(x, y)
plt.show()
Resultado:

Posicionar el título
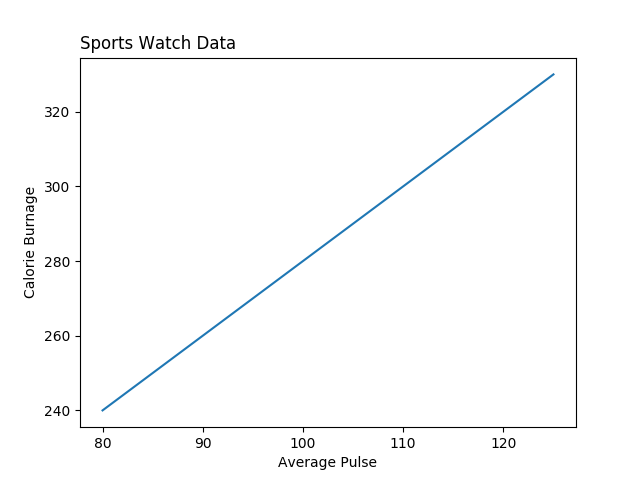
Puede utilizar el parámetro loc en title() para posicionar el título.
Los valores legales son: 'left', 'right' y 'center'. El valor predeterminado es 'center'.
Ejemplo
Coloca el título a la izquierda:
import numpy as np
import matplotlib.pyplot as plt
x = np.array([80, 85, 90, 95, 100, 105, 110, 115, 120, 125])
y = np.array([240, 250, 260, 270, 280, 290, 300, 310, 320, 330])
plt.title("Sports Watch Data", loc = 'left')
plt.xlabel("Average Pulse")
plt.ylabel("Calorie Burnage")
plt.plot(x, y)
plt.show()
Resultado:
